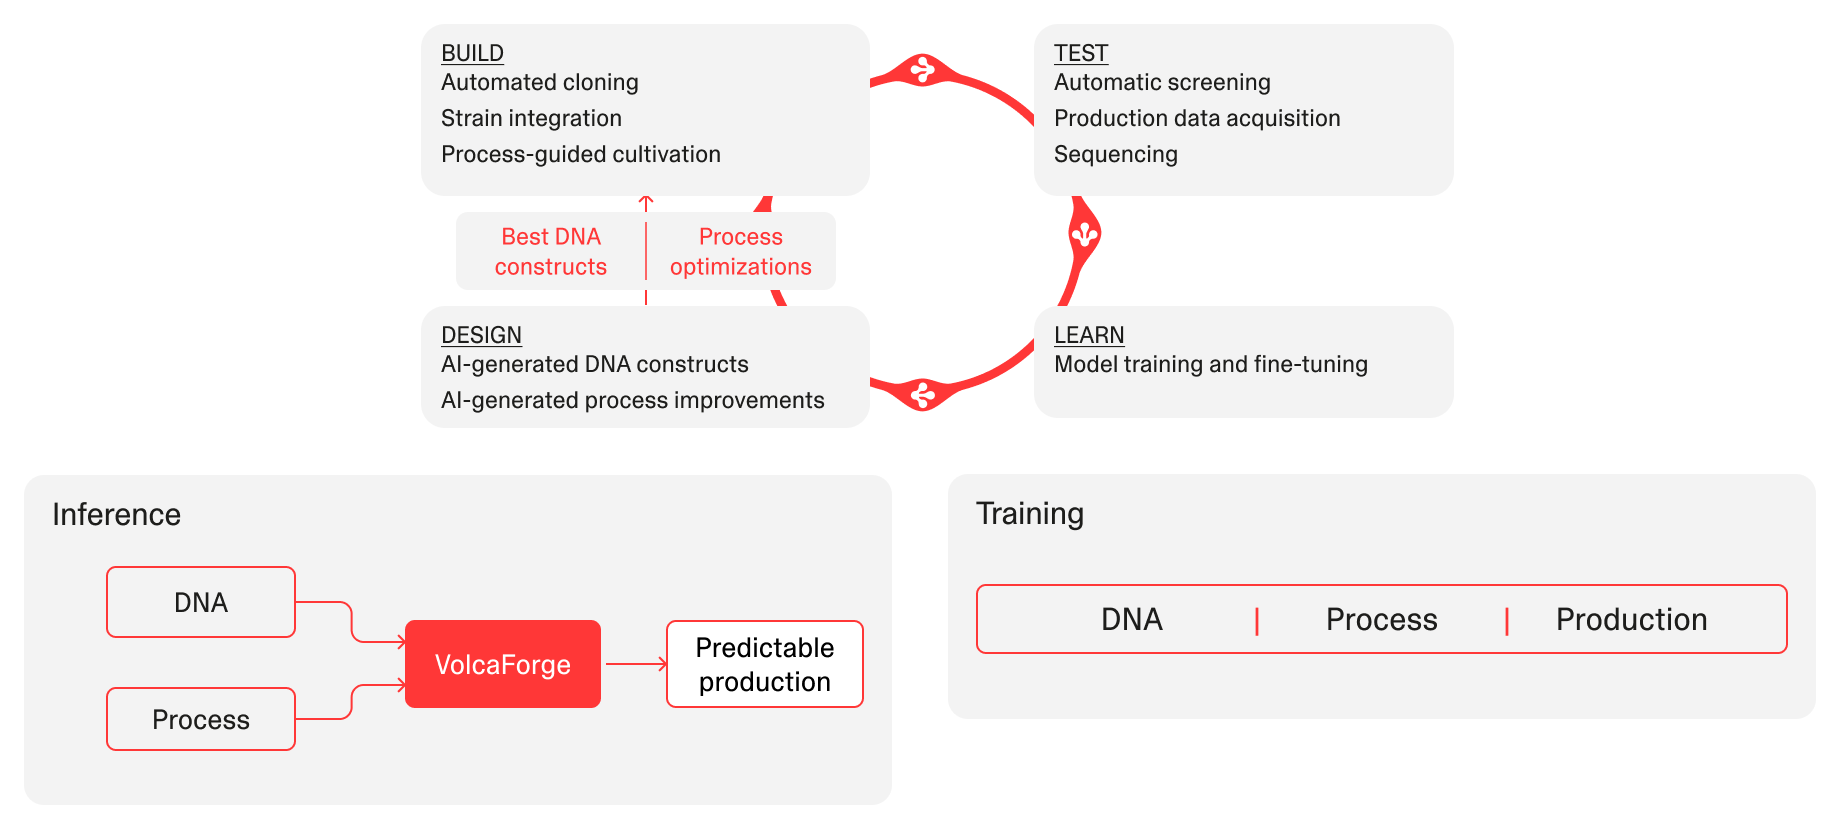
At Volca, we use microorganisms as programmable molecular factories to produce valuable molecules.
Say we want to test 24 different strains to produce a given molecule in flasks. One scientist inoculates the cultures. Another takes samples and records how each strain grows. The third scientist extracts the relevant part of the samples and runs it through the HPLC, an instrument that measures how much of our target compound each strain produced.
That was still our workflow at the start of 2026. At each handoff, someone copied and pasted data from a spreadsheet into a shared file. The results were exported manually from the instrument to Excel, matched to the corresponding samples and pasted into Benchling, an electronic lab notebook.
We learned the cost of that handoff when we pasted an entire row of results one cell too low. The numbers still looked right, but they now belonged to the wrong samples. We used them to decide what to test next and ran three more rounds of experiments before we traced the mistake back to the spreadsheet. That one (spreadsheet) cell cost us weeks of development and thousands of euros.
Our first app helped us work around vendor software
The first internal app we built did one small job. It took a list of DNA primers, registered them in Benchling and generated the order file our supplier needed. Later, we built a tool that made it easier to keep track of tubes in freezer boxes. At that point, our plan was to keep Benchling and fix the bits that made daily life harder than it needed to be. After all, we are an industrial biotech company, not a software company.
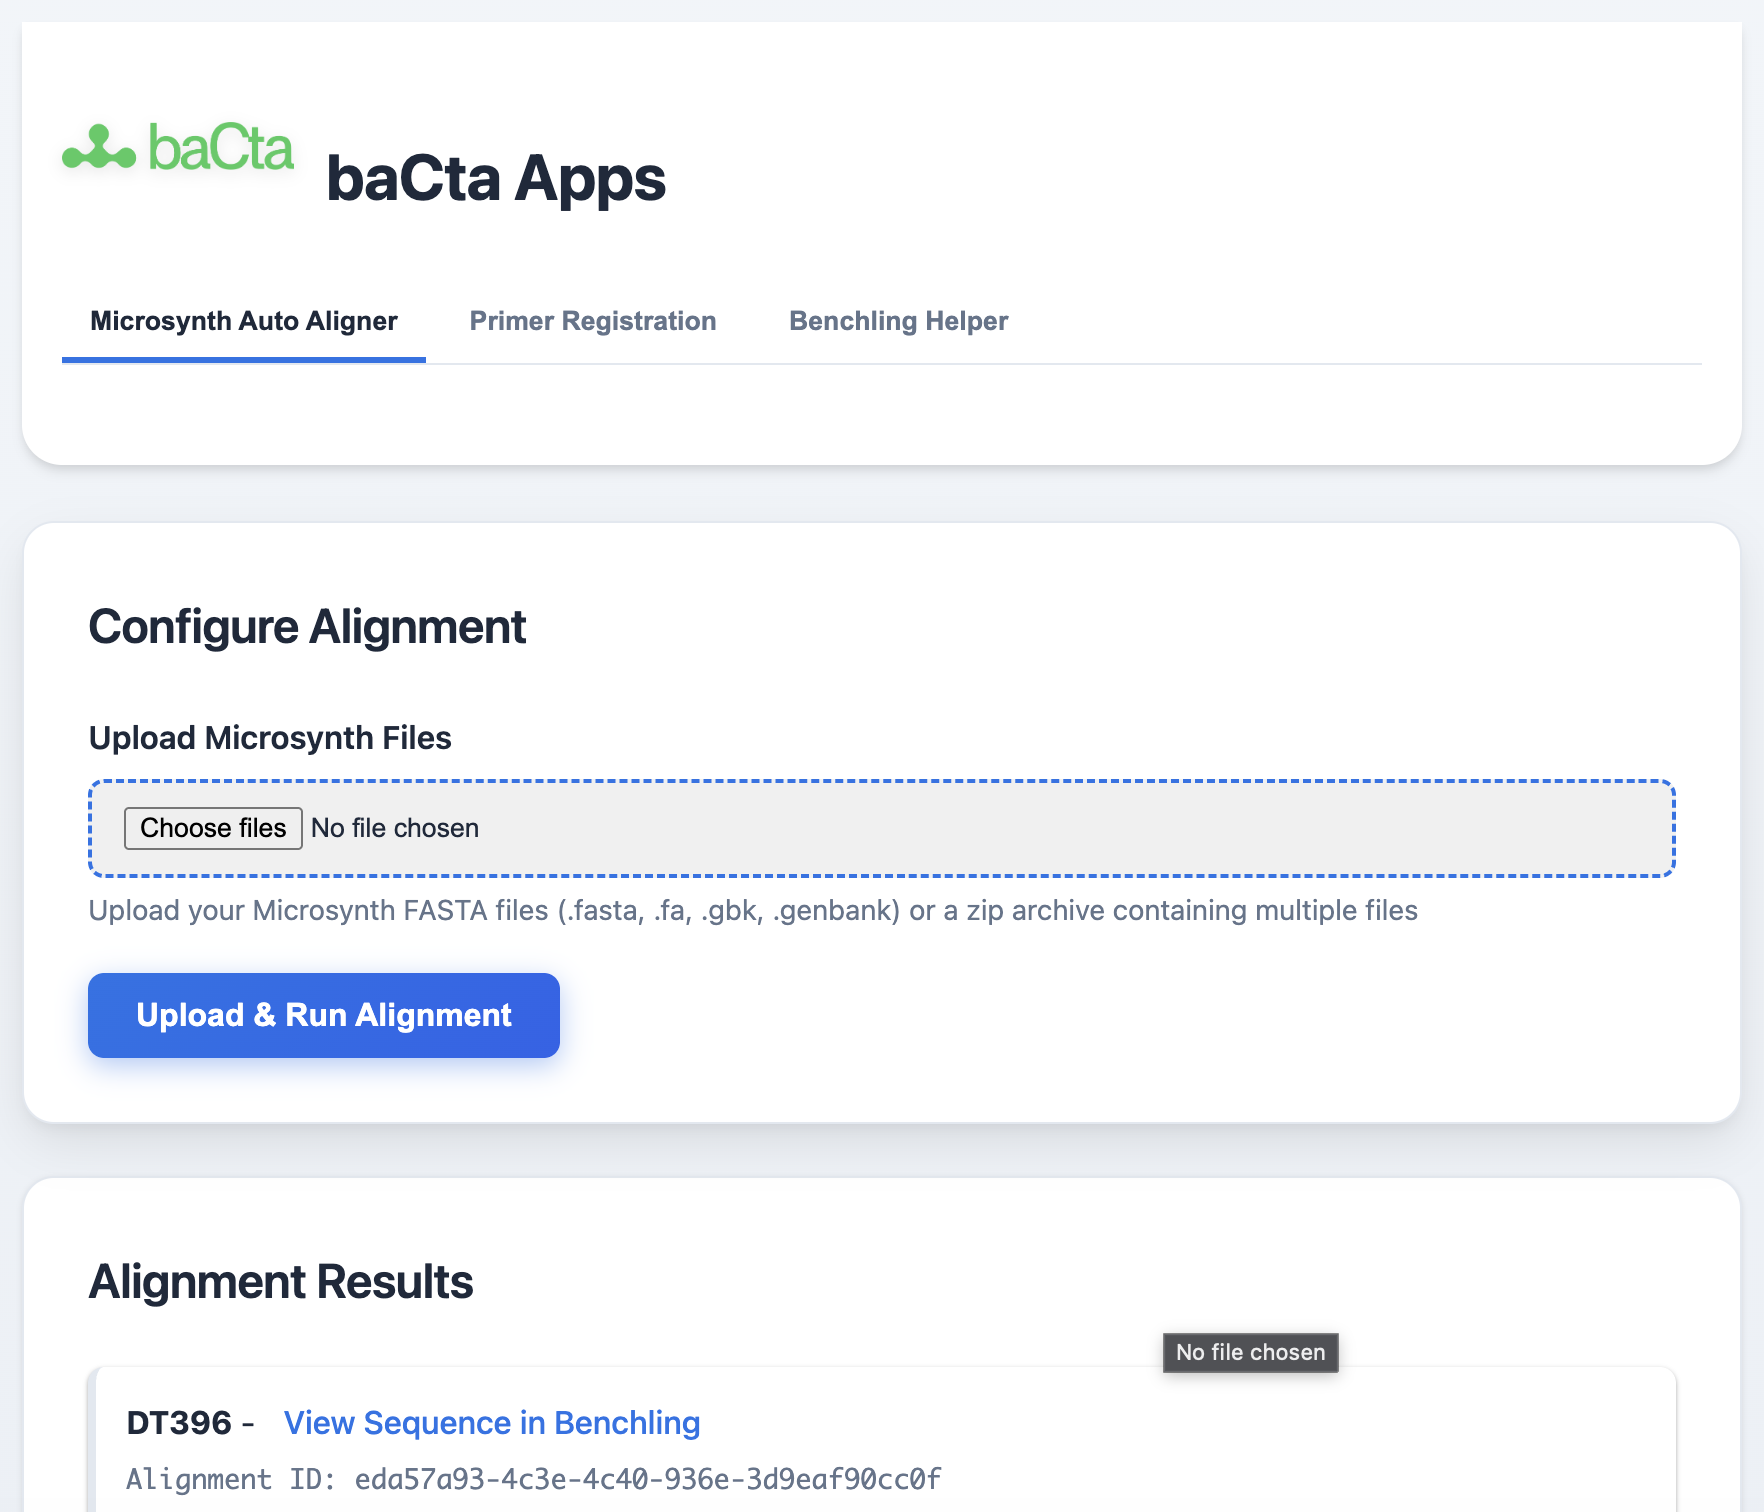
Then, in early 2026, Benchling quoted us five times what we’d been paying.
We tested alternatives. Each fit some parts of the lab and left us working around others. I had spent years as a software developer building data pipelines, and AI-assisted coding tools had made it practical to try something more ambitious.
I decided to see how much of Benchling I could replace myself.
First, give everyone the same experiment record
What started as a small replacement grew over a few months into baCta Apps, now Volca Apps. Together with Notion, it covered our electronic lab notebook, inventory, and a small set of molecular biology and cloning tools built around the way we worked.
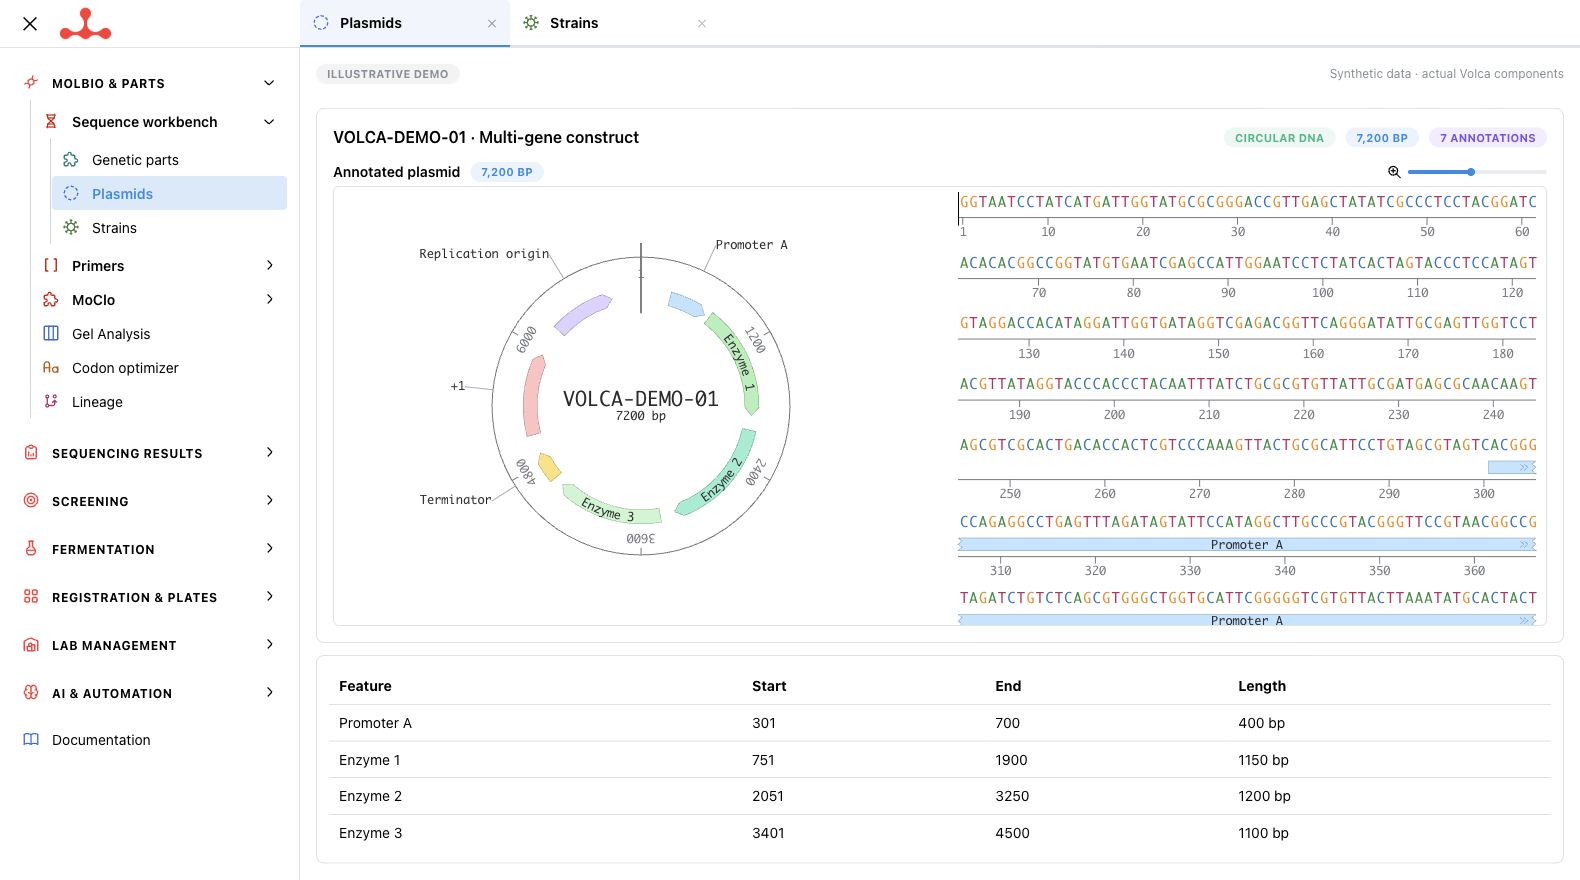
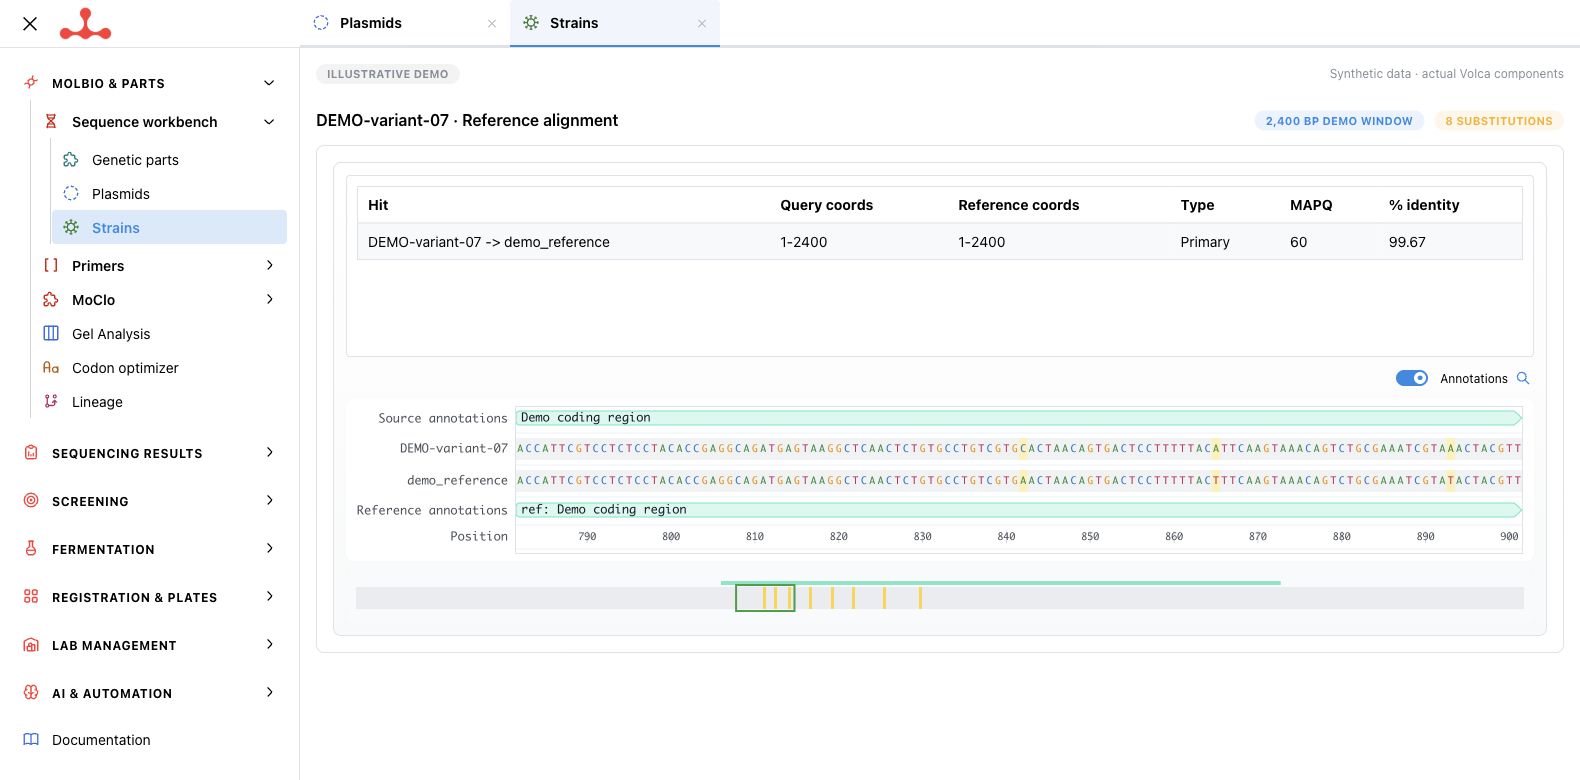
For the 24 flasks, the first improvement was straightforward. The scientist who took a sample registered it against the flask and the experiment. The scientist running the HPLC could put the result on that same sample record. Everyone could open the experiment, see which strains we’d used, find the materials in the freezer and review the results.
But when the HPLC finished a run, someone still had to go and export the file manually, like it was 2010. I’d built a better place to put the results. We still needed a way for the results to get there.
Then, let the machines deliver the data
We put data collectors on our lab machines and added sensors where people were still taking readings by hand. Within a couple of weeks, measurements were flowing into a shared data lake. Both the raw instrument data and the calculated results were linked to the samples and experiments they came from.
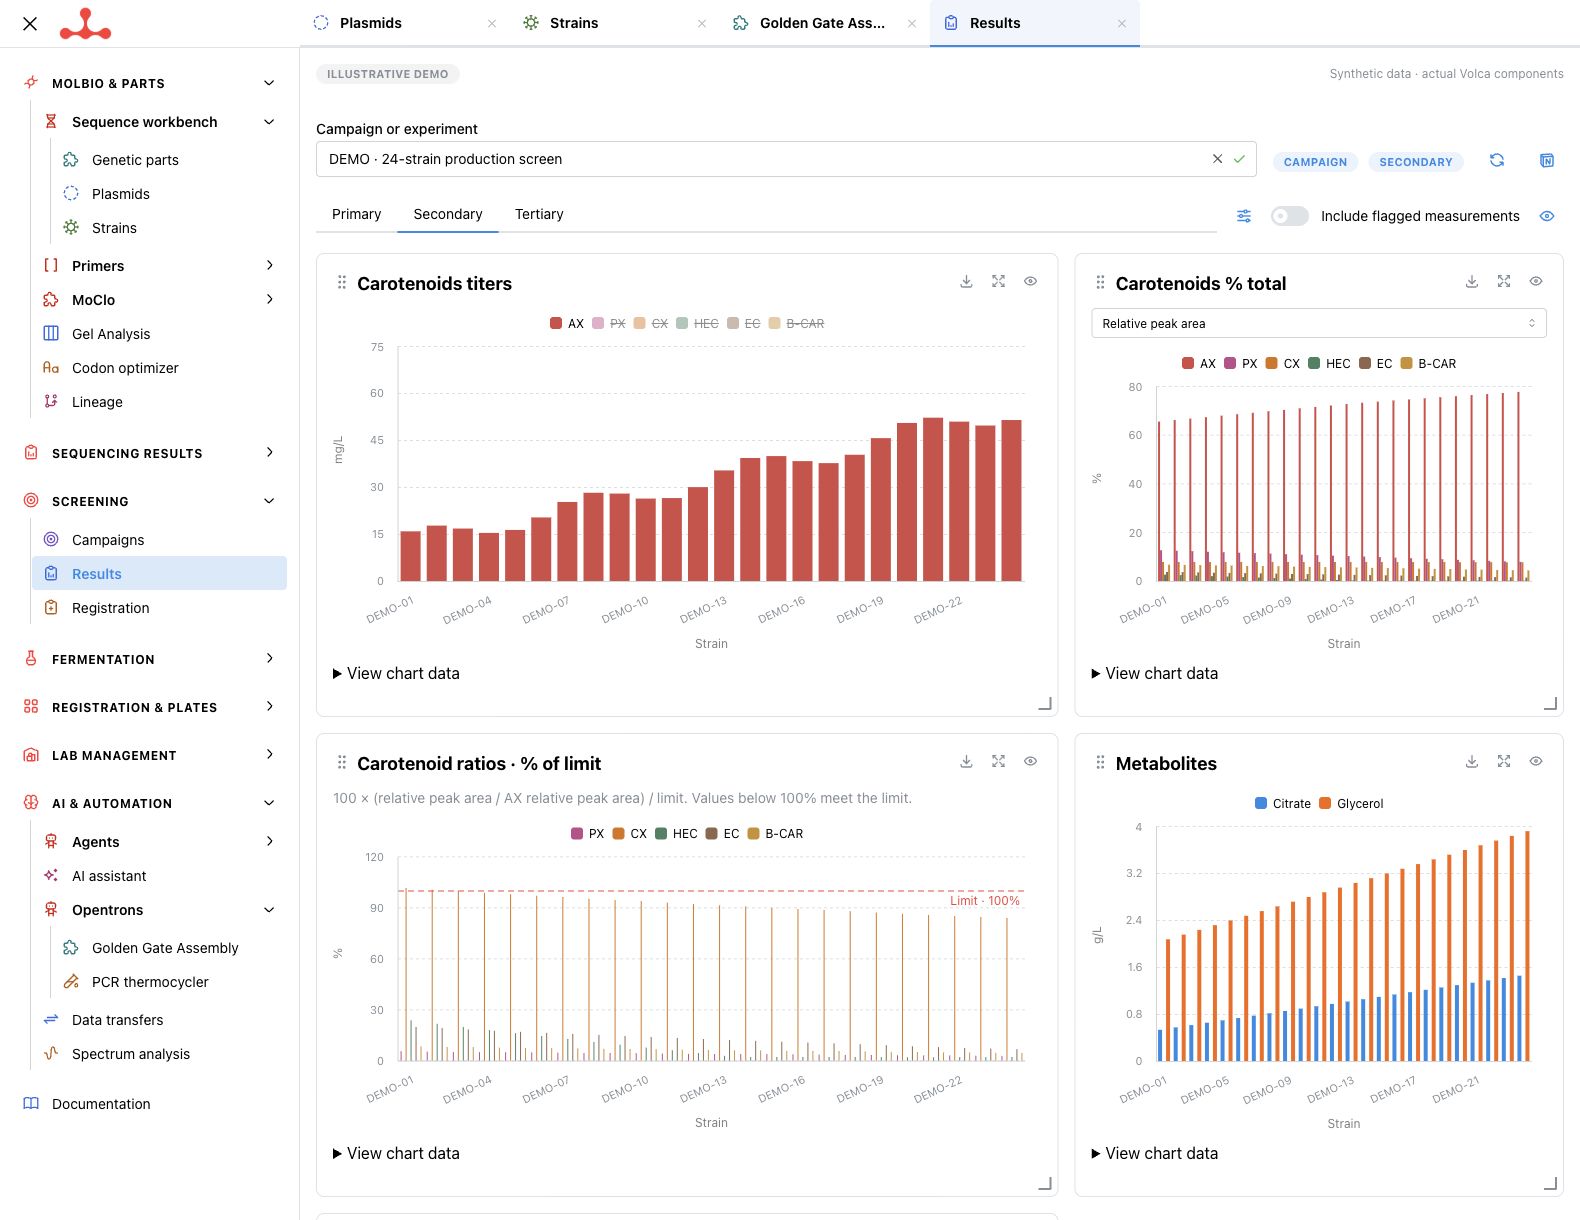
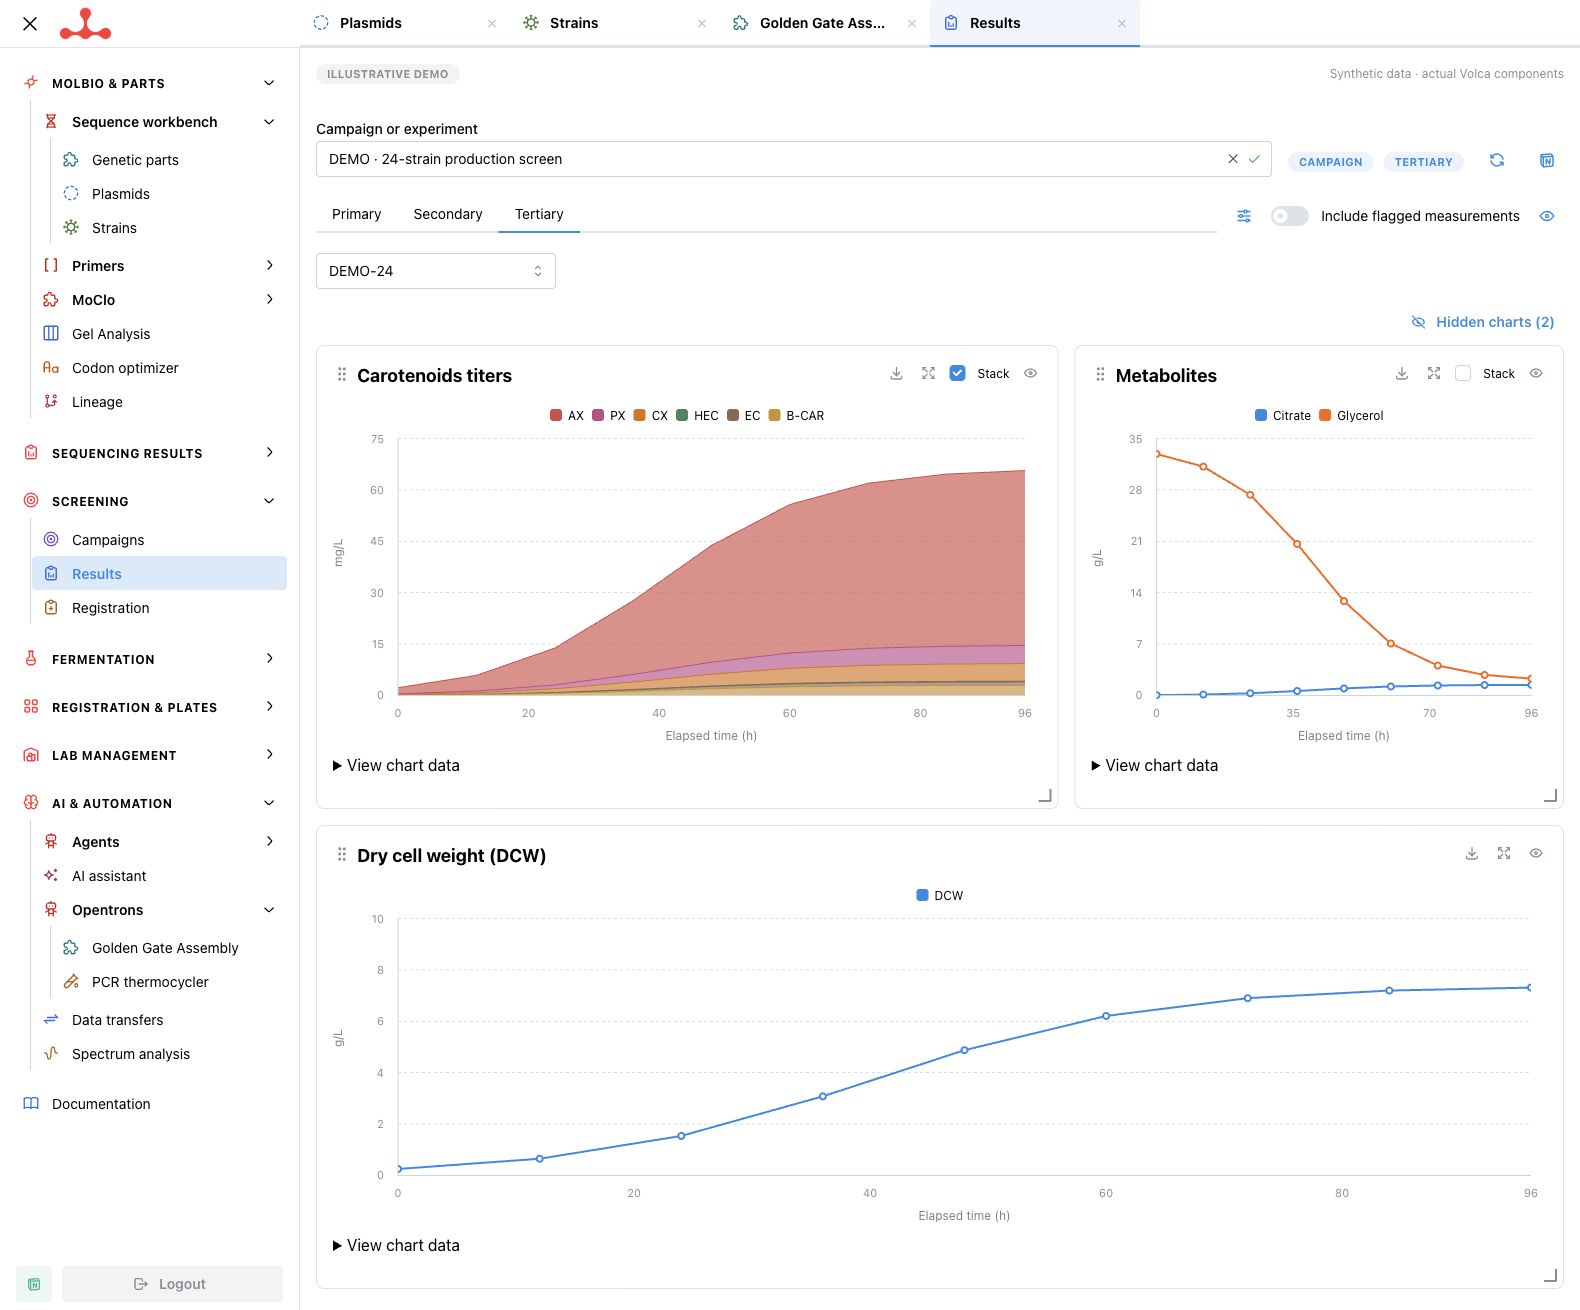
Back at the 24 flasks, we could now follow growth as it happened. Sensors sent readings straight to the database and the growth curves updated in real time. The scientist running the HPLC still had to load it, but the job no longer ended with an Excel export. When the run finished, the results went to the right sample records and the scientist got a Slack notification.
Once that worked, we could build analyses that used the data as soon as it arrived. Volca Apps now handles almost all our analytical pipelines, including sequencing, bioinformatics and genetic analyses.
Finally, let the whole team build
At that point, the instruments could deliver their own results, but every change to the workflow still went through me. If a scientist wanted to process the 24 strains a different way, they had to explain the new workflow to me, wait for me to build it and then tell me what I’d misunderstood.
Automating more of the lab meant giving the people doing the work the tools to change it themselves. Today, a majority of our team can use AI coding tools to build complex workflows.
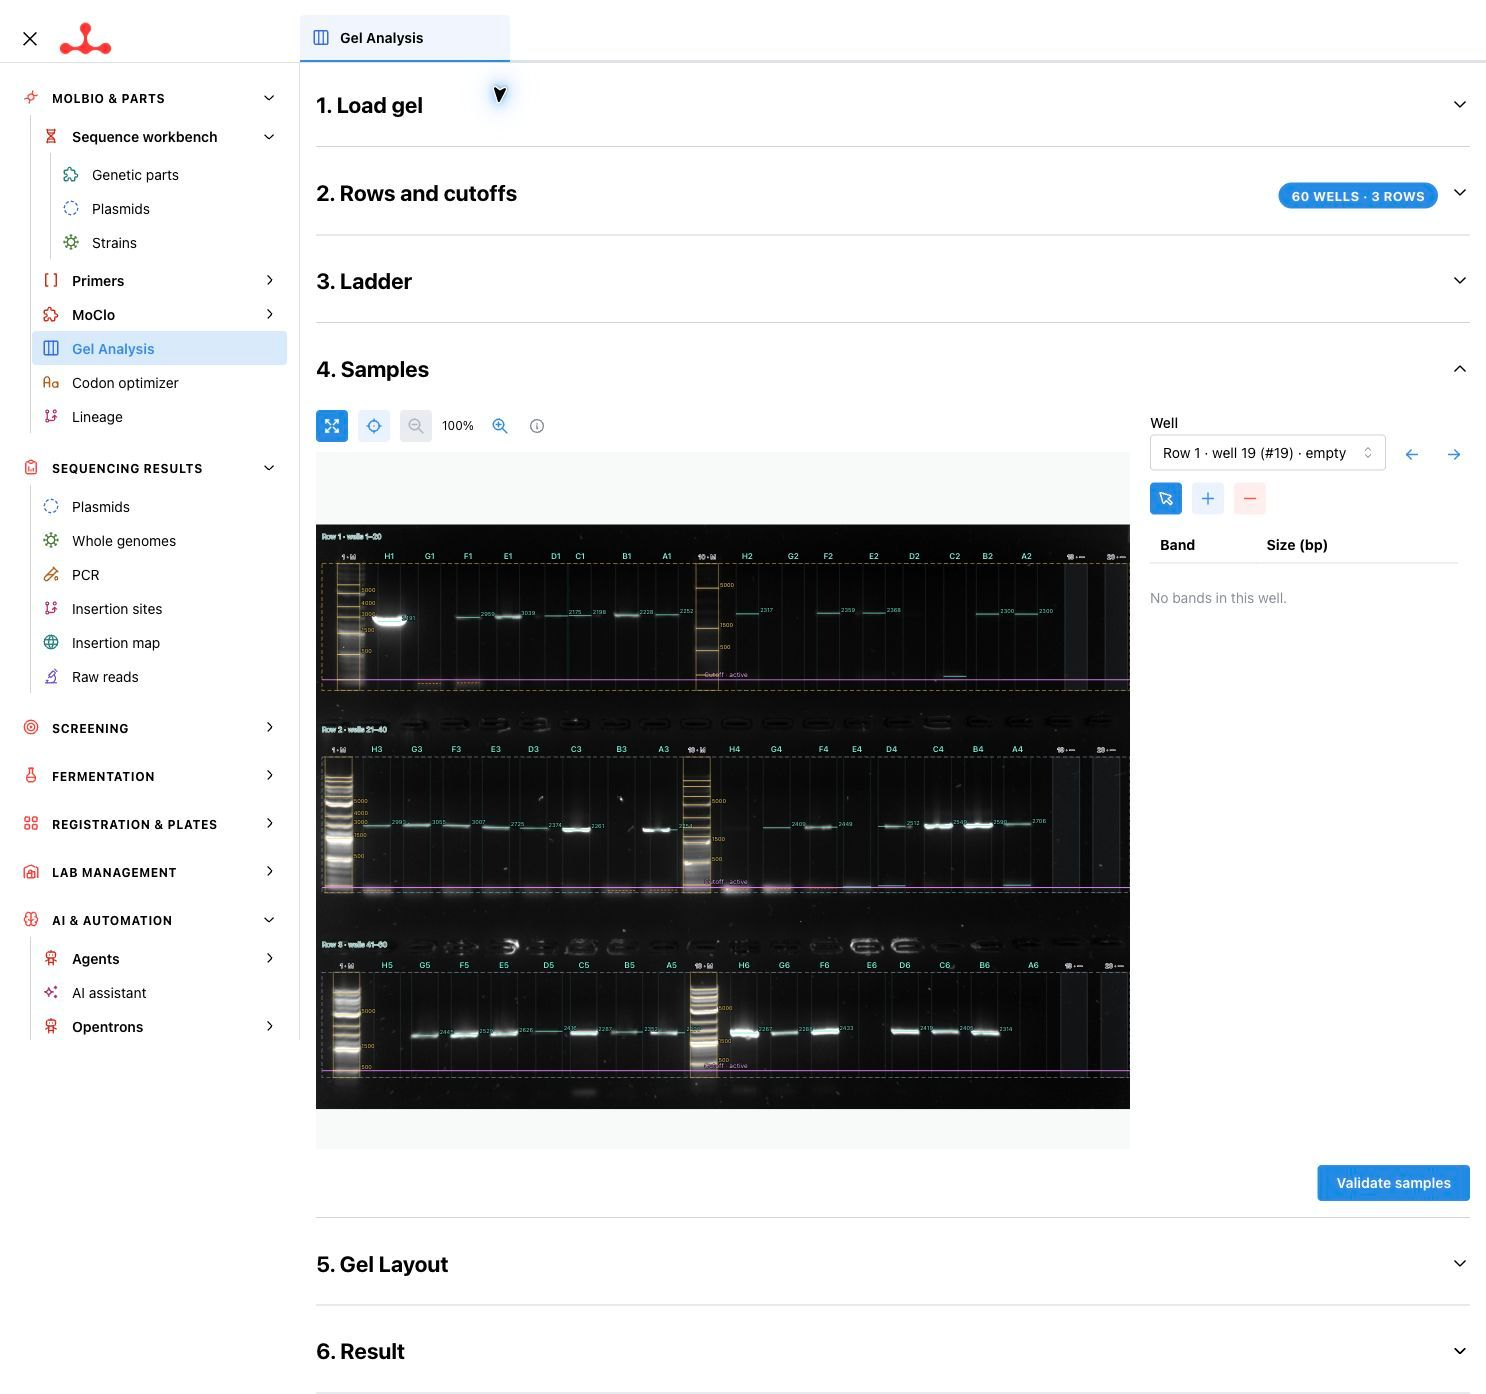
Eva, a metabolic engineer, started by building the gel-image analyzer we now use every day. When someone takes a gel image, the software uploads it to the server, links it to the right construct, and measures the bands in the image.
A few weeks later, we were discussing why we’d stopped photographing some of our lab plates. Taking the pictures and filing them took time, and we rarely went back to look at them. Eva suggested printing a QR code on each label so we could send a photo to Volca Apps in Slack and have it attached to the right strain automatically. “Or is it too futuristic 😬” she added. Within hours, it was live.
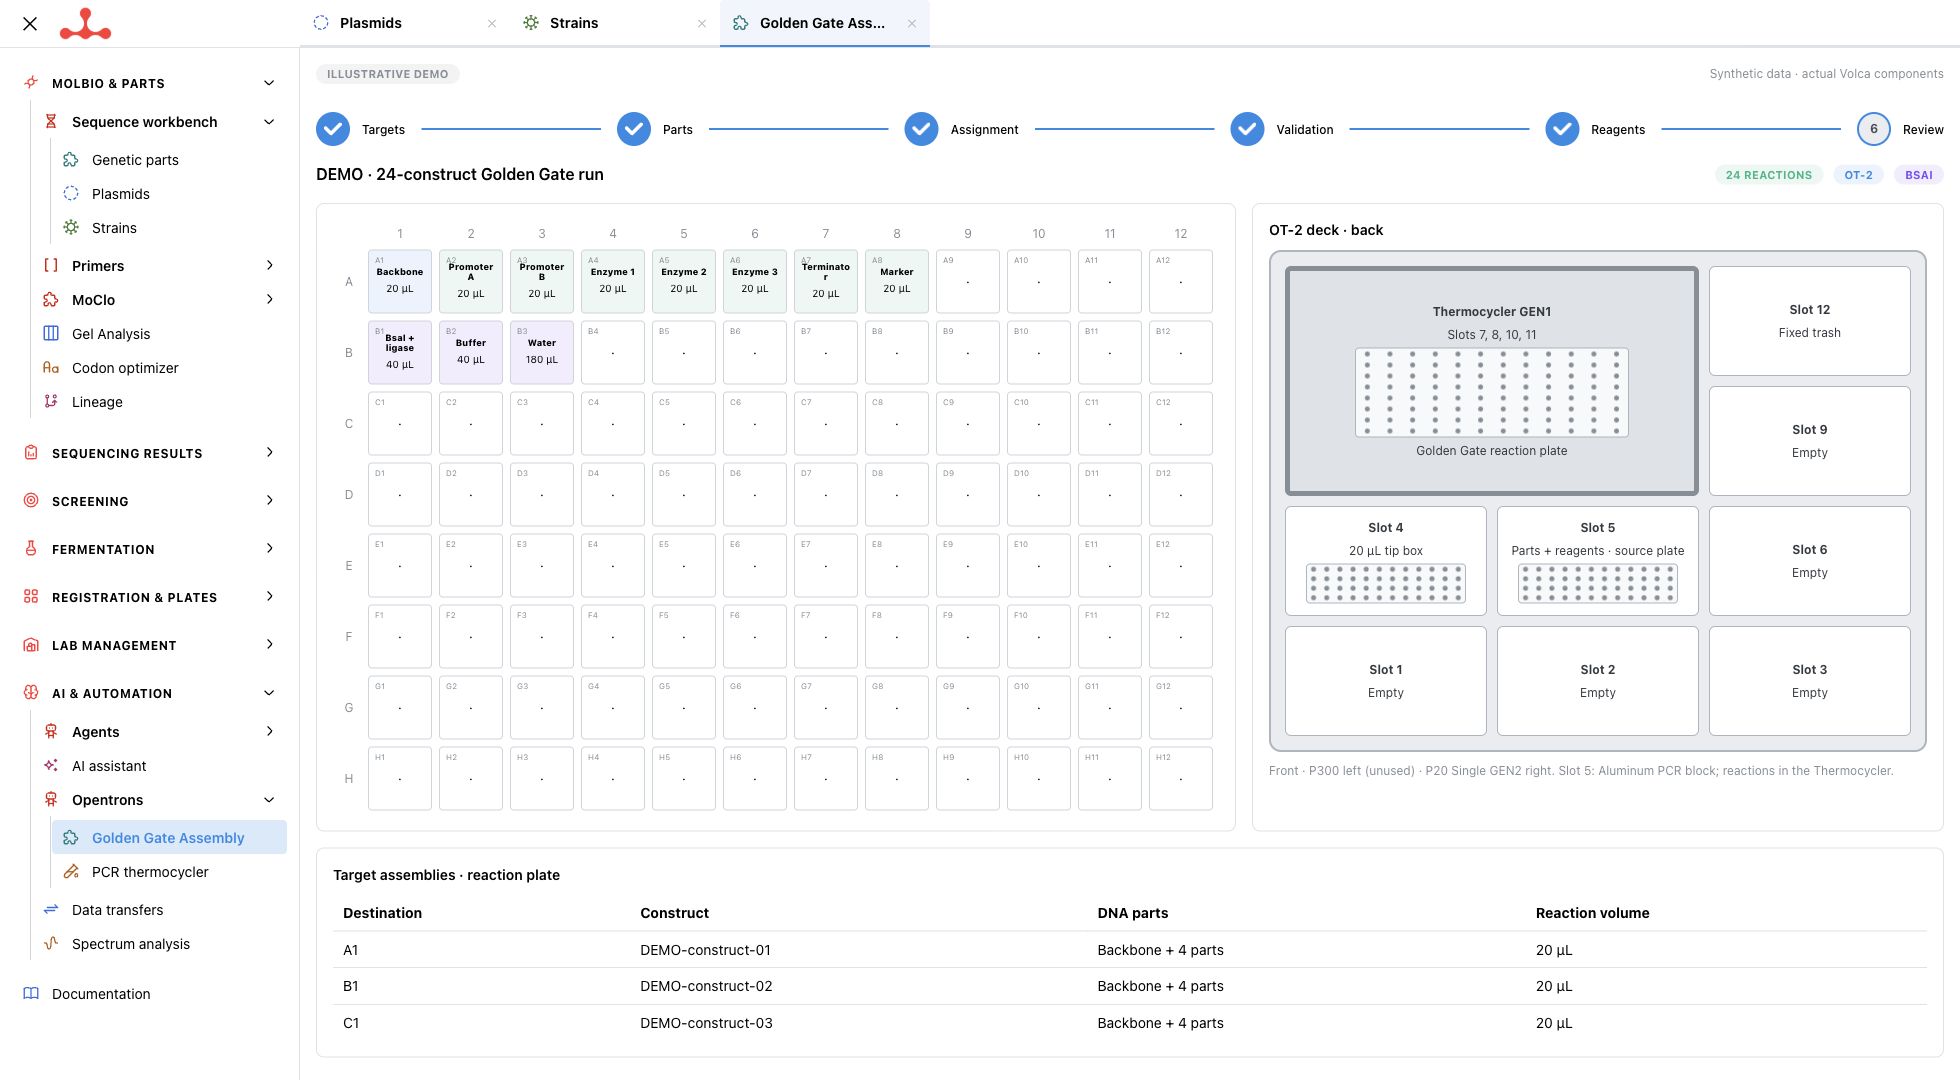
The team can automate physical work this way, too. We use Volca Apps to program our liquid-handling robots. A scientist plans a run using our inventory and generates the instructions it executes.
What's next for autonomous labs
Today, the 24 flasks are set up, and measurements are collected automatically. The scientist can view the growth curve on her laptop. The HPLC runs overnight and the results are analyzed automatically. The charts are ready to open over coffee the next morning. Everyone can see how much each strain produced alongside how well it grew and trace an unexpected number back to the original reading. If the data doesn’t answer a question, we can build a better workflow and iterate on it.
AI already takes a first pass at those results. It compares them with the goal of the experiment, drafts an interpretation and links each finding back to the measurements. Today, our scientists review that analysis and decide what to test next.
The logical next step is to have our genome-to-factory model automatically use the results to propose the next experiment. It can already ingest the data and suggest new genetic constructs.
Finally, we will connect that proposal to the lab’s automation: the experiment will run itself and generate new training data. The model can then compare what it predicted with what actually happened and use the difference to choose the next run. That’s the loop we want to close at Volca. What happens in one set shapes what goes into the next.
That’s where we’re headed. But one of the biggest changes AI has made at Volca is already visible in who builds our tools. I started writing this software because I knew how to build data pipelines. Eva built the gel analyzer because she knew what she needed from a gel image. Both are now part of how the lab works.